 By
Quick answer: What is a typical Series A valuation?
- $63.3 million: Carta's median Series A valuation for 2026, through the end of Q3 (US companies on Carta).
- Up 56% from five years earlier; median Series A round size up 25% on 2021.
- Seed for comparison: median seed valuation $19.7 million in 2026 through Q3.
- Sector spread: hardware Series A median pre-money $108.4 million on a $26.1 million median round.
- Median, not average: a few very large rounds would distort a simple mean.
Key takeaways
- Quote Series A data with its source, region and period, or not at all.
- A median tells you the middle deal, not what your company will get.
- Sector and geography move the number more than any formula.
- Higher valuations raise the bar for the next round.
- Traction evidence, not the market median, sets your price.
"What's a normal Series A valuation right now?" is one of the most searched fundraising questions, and one of the most badly answered: numbers float around without a source, a date or a definition. This page answers it from one dated, primary dataset, Carta's State of Private Markets: Q3 2026, quoted exactly, with what the figure covers and what it doesn't. Then it turns to what matters more for your company: the traction that moves you above or below the median. Data was read on 18 November 2026; we'll update this page when the next quarter's report is published. Jump to the data, why medians mislead or the traction investors expect.
What is the average Series A valuation in 2026?
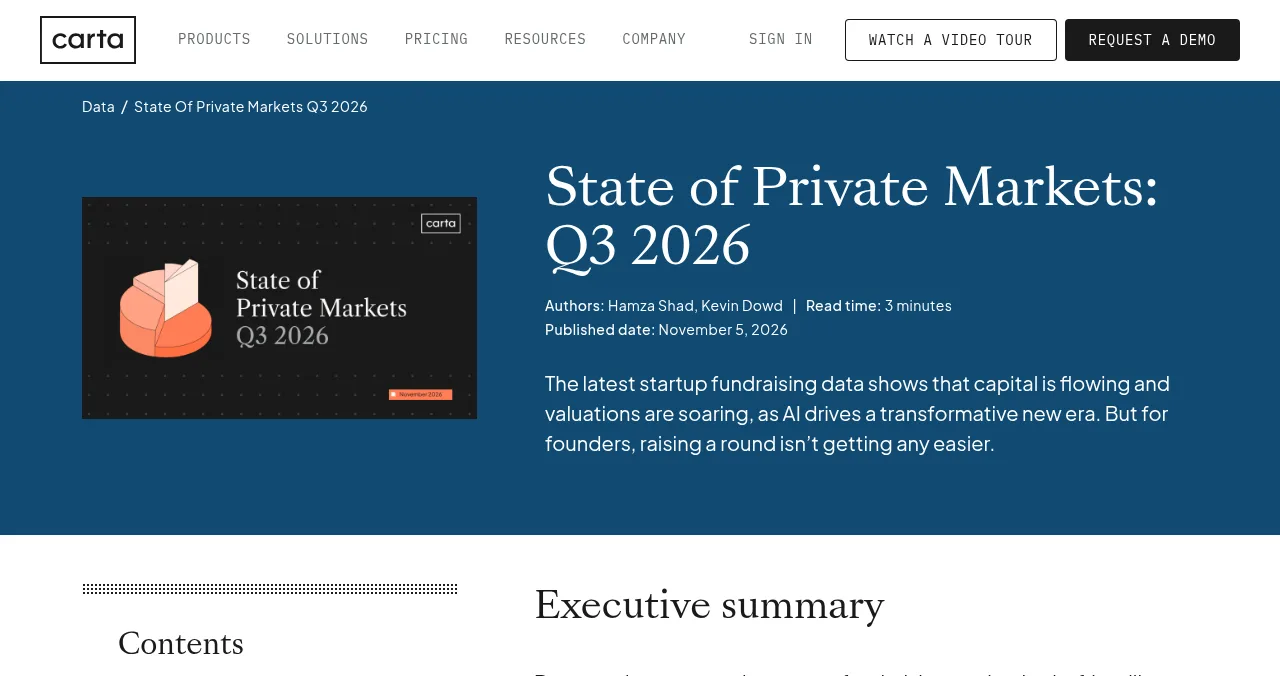
Carta's State of Private Markets: Q3 2026 (published 5 November 2026, a snapshot as of 1 November 2026) states that the median Series A valuation in 2026, through the end of Q3, is $63.3 million, a 56% increase from five years earlier.
| Measure (Carta, 2026 through Q3) | Figure | Change Carta reports |
|---|---|---|
| Median Series A valuation | $63.3 million | Up 56% from five years earlier |
| Median Series A round size | Not restated in the passages checked | Up 25% vs 2021 |
| Median seed valuation | $19.7 million | Up 84% vs full-year 2021 |
| Median seed round size | Not restated in the passages checked | Up 50% vs 2021 |
| Median Series B pre-money valuation | Not restated in the passages checked | Up 25% from 2025 to 2026; round size roughly flat |
| Hardware: median Series A pre-money | $108.4 million | Carta says hardware's gap over other common sectors is even wider at Series A than at seed |
| Hardware: median Series A round size | $26.1 million |
Table: Series A and seed valuation data from Carta's State of Private Markets: Q3 2026 (US companies on Carta; checked 18 Nov 2026)
What does Carta's figure cover?
Carta's methodology note says financings include equity deals raised in US dollars by US-based corporations on its platform. The "series" label comes from the share class name in the company's charter; rounds that don't follow that naming are left out of the by-series data. Primary rounds are the first equity round within a series; later rounds in the same series count as bridges.
One more detail matters when you compare numbers. Carta describes its Series B and hardware figures as pre-money valuations; the overall Series A sentence says "median Series A valuation" without specifying. If you're comparing it with your own pre-money, check the full report's chart labels.
Why medians, not averages?
Most venture datasets report medians because a handful of very large rounds would drag a simple average far above the typical deal. The median is the middle deal: half of Series A rounds in Carta's 2026 data priced above $63.3 million, half below. That still hides a wide spread:

- Sector — Carta's hardware Series A median pre-money of $108.4 million is far above the overall median
- Geography — Carta's data is US-only; Series A rounds elsewhere usually price in a different market
- Round size — bigger rounds generally come with bigger valuations
- Platform — Carta sees companies that use Carta; other datasets see different populations
- Timing — medians move every quarter; a 2026 figure won't describe a 2027 round exactly
So "average Series A valuation" is a useful sanity check, not a target. Investors will price your company on its own evidence.
What other Series A data sources are there?
The PitchBook-NVCA Venture Monitor is a quarterly report on US venture activity (investment, fundraising and exits) published by the National Venture Capital Association with PitchBook as its data provider; the Q3 2026 edition covers data through September 2026. NVCA's page doesn't quote Series A valuation medians, so we haven't used it for the headline figure. If you compare datasets, compare like with like: same quarter, same region, same definition of a round, and pre-money against pre-money.
How does Series A fit the dilution path?
Carta's report includes a useful reality check: if a hypothetical company raised every round from seed through Series D at 2019's median rates, the compounded dilution across all rounds would be about 66%. Higher valuations in 2026 mean less dilution per round, but they also raise the bar for the next one. Our startup valuation guide shows how to plan your own dilution path, and the VC method guide shows how investors build future rounds into today's price.
What traction do you need for a Series A?
No primary source sets a universal bar, so be wary of anyone who quotes one as fact. What Series A investors evaluate is consistent, though: evidence that customers find the product, adopt it, keep using it and pay for it, and that growth can scale with more capital.
| What investors ask | Evidence that answers it |
|---|---|
| Is revenue real and growing? | Monthly revenue by cohort, growth rate, churn |
| Do users stay? | Retention curves, not just total sign-ups |
| Can new customers adopt it alone? | Activation rate, onboarding completion, an independent product test |
| Can you reach customers efficiently? | Acquisition cost by channel, organic discoverability |
| Is the product sound under diligence? | Speed, accessibility, security and quality evidence |
| Can this team scale? | Hires made, leadership gaps filled |
Table: Series A traction questions and the evidence that answers them (Science of Apps editorial framework)
Our 30-point startup evaluation framework covers how investors weigh each area by stage. If you're not sure you need venture money at all, read bootstrapping vs VC funding first.
The Science of Apps Launchpad: a public proof point
Listing is free, forever: six short steps, automated checks and human moderation, ranked by relevance, editorial picks and community interest, never payment ("0 paid placements"). You go live with a Featured badge and can earn Verified (work email on your domain), Community favourite and Editor's pick; vouches and followers show community interest publicly. A free baseline diagnosis of your landing page, discoverability and speed runs as you go live.
For the product questions in diligence, the investigation tests your product end to end in a real browser on desktop and mobile, re-cut for your category, and hands you a detailed report.
- Areas, Arrive to Stay
- 22
- Automatic measurements
- 39
- Expert heuristics
- 74
- Verdicts per finding
- 5
Know what investors will find first
List free, then order the report that fits your round.

 Economy
See what new customers see
- Store listing and homepage, screen by screen
- Scorecard against 60 Laws of UX
- The fixes worth most
PremiumThe full diagnosis and the plan
- Every screen, every finding, every flow
- All 60 laws with evidence and fixes
- 8 strategy chapters and a 90-day roadmap
Fact-checked against the evidence. Private by default.
Findings are analyst-reviewed, private to your team and never affect your ranking. An optional Premium listing exists (a labelled spotlight plus five articles); it doesn't change organic ranking.
A 90-day plan before a Series A process
- Days 1–7
Public profile
List free on the Launchpad; read the baseline diagnosis.
- Days 8–30
Fix the product
Close Critical findings in onboarding, the core flow and payments.
- Days 31–60
Clean metrics
Build cohort retention and revenue charts from raw data.
- Days 61–80
Benchmarks
Pull the latest Carta quarter for your sector; note the period and region.
- Days 81–90
Data room
Metrics, product evidence, cap table, 409A history and the deck.
Series A valuation mistakes

- Quoting an unsourced "average" — give the dataset, quarter and region, or don't quote it
- Using US medians outside the US — match the market you're raising in
- Optimising only for the headline number — the terms and the next round matter as much
- Totals instead of cohorts — investors read retention, not cumulative sign-ups
- Anchoring on the median — it becomes the anchor for both sides; lead with your own evidence
Ready to launch?
How we know
Every Series A, seed, Series B and hardware figure, and the methodology note, comes from Carta's State of Private Markets: Q3 2026 (published 5 November 2026; snapshot as of 1 November 2026). The Venture Monitor details come from NVCA's own page. Both were read on 18 November 2026; we'll refresh this page when Carta publishes its next quarter. The traction table is Science of Apps' editorial framework, not market data. Science of Apps runs the Launchpad; its details come from its own pages, checked the same day.
Key terms, defined
- Series A: usually the first priced venture round after seed, named for the share class it creates.
- Median valuation: the middle value when all deals are ranked; half are above, half below.
- Pre-money valuation: the company's value before the new investment.
- Primary round: in Carta's data, the first equity round within a series.
- Bridge round: in Carta's data, any round raised after the first in the same series.
- Dilution: the fall in existing owners' percentage when new shares are issued.
Frequently asked questions
What is a typical Series A valuation?
Carta's State of Private Markets: Q3 2026 reports a median Series A valuation of $63.3 million for 2026 through the end of Q3, covering equity rounds raised in US dollars by US-based companies on its platform. That's up 56% from five years earlier. Treat it as the middle of a wide range: sector, region and traction move individual deals far above or below it.
What is the average Series A valuation in 2026?
Most public datasets report medians rather than averages, because a few very large rounds would pull a simple mean upwards. Carta's median Series A valuation for 2026, through Q3, is $63.3 million. If you see a much higher "average" quoted without a source, it may be skewed by outliers or drawn from a different population.
How much do startups raise at Series A?
Carta's Q3 2026 report says median Series A round size is up 25% compared with 2021 but doesn't restate the overall figure in the passages we checked. By sector, it reports a median Series A round of $26.1 million in hardware in 2026. Your round size should come from what you need to reach the milestones for Series B.
How does Series A valuation compare with seed?
Carta reports a median seed valuation of $19.7 million in 2026 through Q3, up 84% on full-year 2021, against $63.3 million at Series A. Seed round sizes are up 50% on 2021 and Series A round sizes 25%, so valuations have risen faster than the amounts raised at both stages.
What traction do you need for a Series A?
There's no universal bar, and no primary source sets one. Investors generally look for evidence of product-market fit: revenue growing quickly, users who stay, efficient acquisition, and a product new customers can adopt without hand-holding. Bring the data behind each claim; a public launch history and an independent product test add evidence beyond your own dashboard.
Where can I find reliable Series A valuation data?
Carta's quarterly State of Private Markets report publishes medians for US companies on its platform, with a methodology section. The PitchBook-NVCA Venture Monitor is a quarterly report on US venture activity from the National Venture Capital Association and PitchBook. Always note the quarter, the region and how each dataset defines a round.
Is a higher Series A valuation always better?
No. A higher valuation means less dilution now but a higher bar later: if the company doesn't grow into it by the Series B, the next round may be flat or down. Carta's report shows Series B pre-money medians up 25% from 2025 to 2026, so investors at the next stage are also pricing high and expecting growth.
Sources
- Carta — State of Private Markets: Q3 2026, full report, published 5 Nov 2026, data snapshot as of 1 Nov 2026 (checked 18 Nov 2026)
- Carta — State of Private Markets: Q3 2026, summary (checked 18 Nov 2026)
- NVCA — PitchBook-NVCA Venture Monitor, Q3 2026 edition (checked 18 Nov 2026)
- Kauffman Foundation — Valuation of Pre-revenue Companies: The Venture Capital Method, by Bill Payne (checked 18 Nov 2026)
- Y Combinator — Documents: the post-money SAFE (checked 18 Nov 2026)
- Science of Apps — Launchpad: list your startup free (checked 18 Nov 2026)
- Science of Apps — Product investigation: 22 areas (checked 18 Nov 2026)
- Checked November 18, 2026. Figures that change — fees, salaries, prices — are reviewed every six months; if something is out of date, tell us.
Where to go from here
- Startup valuation — every method, compared
- Bootstrapping vs VC funding — do you need a Series A at all?
- How to evaluate a startup — what investors score
- Science of Apps - LaunchpadPre-revenue startup valuation: how investors value a startup with no revenue, the methods they use, what published pre-seed valuation data shows and the evidence that raises your numberHow pre-revenue startups are valued: Berkus, scorecard and VC methods, dated pre-seed valuation data, and the evidence investors accept with no revenue.
- Science of Apps - LaunchpadScorecard method valuation step by step: Bill Payne's seven weighted factors, how to set the baseline, his worked example, a second illustrative example and how to raise your product scoreScorecard method valuation: start from the median pre-money of comparable funded startups, then weight seven factors. Bill Payne's steps and examples.
- Science of Apps - LaunchpadThe VC valuation method explained: the formula from exit value and target return to pre-money, dilution and retention, a worked example and how milestones lower the return investors demandThe VC valuation method divides a startup's expected exit value by the investor's target return to get post-money value. Formula, dilution and an example.
- Everyday design scienceWhy is the keyboard QWERTY? What the patents, telegraphs and typing data actually showKeyboards are QWERTY because of an 1870s typewriter, not a plan to slow typists. What patents, telegraph history and 136 million keystrokes reveal about it.
- Science of Apps - LaunchpadStartup due diligence checklist: the 60 questions investors ask about team, market, product, traction, financials and legal, the documents to prepare, and how to answer the product half with evidenceA startup due diligence checklist: 60 questions investors ask on team, market, product, traction, financials and legal, plus the data room and a product report.
- Startups in IndiaHow to raise seed funding in India: sources, instruments, timelines and what investors checkHow to raise seed funding in India in a tighter market: who invests, which instruments to use, how to run the process and what investors check at seed.






Get the ideas, not the noise.
Sign up with Google and we’ll send you short UX psychology tips by email — why people tap, stall and leave, and what to do about it. Unsubscribe anytime. Prefer something to keep? Get the free Laws of UX guide as a PDF.
Launch day ends. Your listing shouldn't.
Series A investors look for proof that customers find, use and keep your product. List free on the Science of Apps Launchpad for a permanent public profile and an end-to-end product test with a detailed report.