Goal-Gradient Effect
People speed up their effort as they get closer to a goal, so visible progress — even artificial head starts — increases completion.
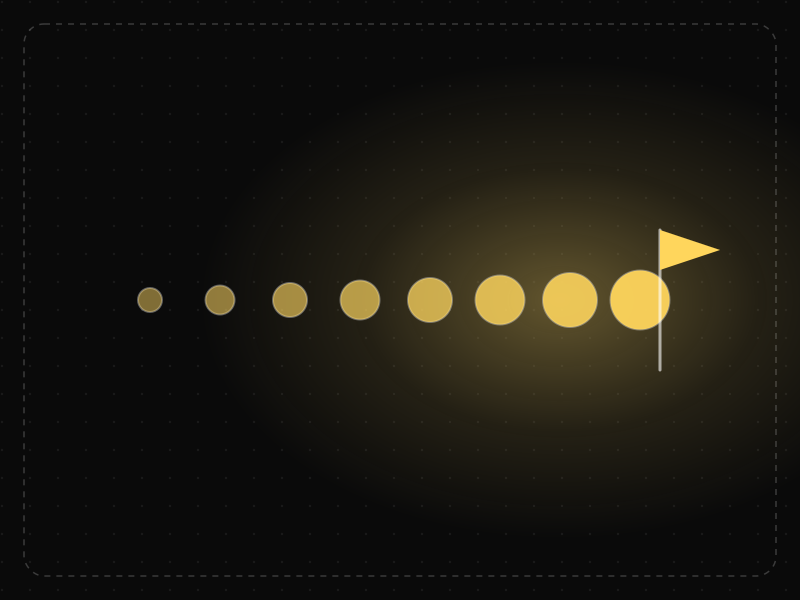
See it in action
The same screen without and with Goal-Gradient Effect. Watch both sides play out, then compare the outcome.
Starting at zero, the goal feels far away and visits stay slow and steady.
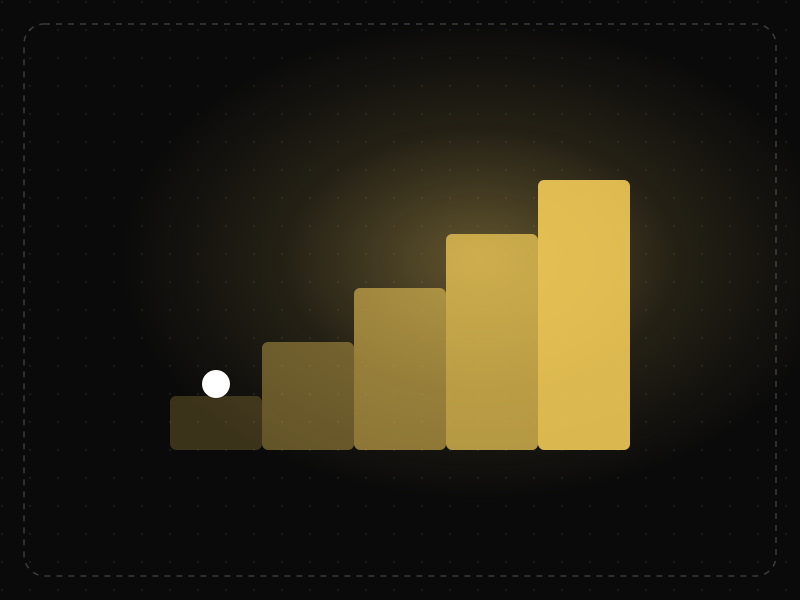
The same 10 purchases, but a head start makes progress feel real — in Kivetz's study this card was completed faster, and visits sped up near the end.
What to watch: the stamps arrive faster and faster as the goal gets closer.
Show progress clearly, give an honest head start and break long goals into visible steps.
Fake progress or move the finish line once people are close.
Key takeaways
- Show progress clearly, especially in onboarding and multi-step flows.
- Giving users a head start (some progress already complete) increases follow-through.
- Shorter remaining distance is a stronger motivator than total distance.
Quick facts
- Also known as
- —
- Described by
- Clark Hull
- Year
- 1932
- Category
- Motivation & emotion
- Related laws
- Zeigarnik Effect, Endowment Effect, Flow, Commitment & Consistency
Goal-Gradient Effect explained
The goal-gradient effect describes how people speed up their effort as they get closer to a goal. The nearer the finish line feels, the more motivated they become to reach it.
Perception matters more than reality. Showing that someone has already made progress, even artificial progress such as a head start, makes the remaining distance feel shorter and increases the chance they finish.
In products, this makes progress indicators, checklists and milestones powerful motivators for onboarding, profile completion, learning paths and loyalty programmes.
Where it comes from
Behaviorist Clark Hull proposed the goal-gradient hypothesis in 1932 after observing rats running faster as they neared food at the end of a maze. In 2006, Ran Kivetz, Oleg Urminsky and Yuhuang Zheng showed the same pattern in people: coffee-shop customers bought more often as they neared a free reward, and a 12-stamp card with two stamps pre-filled was completed faster than a 10-stamp card starting empty.
How it shows up in apps
Profile completion meters, onboarding checklists and streaks all use the goal gradient. The first step should feel already started, and the last steps should feel close.
Goal-Gradient Effect examples
An onboarding checklist that starts at '2 of 6 complete' (account created, email verified) gets more users to finish setup than one that starts at zero.
The coffee card study
Researchers found that customers given a 12-stamp loyalty card with 2 stamps already filled completed it faster than customers given a 10-stamp card with none filled, even though both needed 10 purchases.
Profile completeness bars
Professional networks and marketplaces show a profile strength meter that starts partly full, nudging users to add the last few details because they are already most of the way there.
Onboarding checklists
A setup checklist that ticks off 'Create account' automatically as step one shows immediate progress and encourages new users to complete the remaining steps.
How to apply Goal-Gradient Effect
- Show visible progress through multi-step flows such as onboarding, checkout and setup.
- Give users a head start by counting steps they have already completed, such as creating an account.
- Break long journeys into milestones so the next goal always feels close.
- Celebrate progress at meaningful points to reinforce momentum.
- Keep the remaining steps honest; inflated progress that suddenly stalls destroys trust.
Want Goal-Gradient Effect checked in your own product? Our saas ux audit evaluates it alongside the other principles that shape how users decide, onboard and stay.
Common mistakes
- Showing a progress bar that moves slowly or backwards, which demotivates rather than encourages.
- Hiding how many steps remain, which makes users unsure whether finishing is worth it.
- Using fake progress to pressure users into actions that do not benefit them.
How to measure it
Compare completion rates of multi-step flows with and without progress indicators or head starts, and look at where in the journey people drop off. Time between steps should shorten as users near the end if the effect is working.
Frequently asked questions
What is Goal-Gradient Effect?
People speed up their effort as they get closer to a goal, so visible progress — even artificial head starts — increases completion.
Where does Goal-Gradient Effect come from?
Behaviorist Clark Hull proposed the goal-gradient hypothesis in 1932 after observing rats running faster as they neared food at the end of a maze. In 2006, Ran Kivetz, Oleg Urminsky and Yuhuang Zheng showed the same pattern in people: coffee-shop customers bought more often as they neared a free reward, and a 12-stamp card with two stamps pre-filled was completed faster than a 10-stamp card starting empty.
How does Goal-Gradient Effect apply to app design?
Profile completion meters, onboarding checklists and streaks all use the goal gradient. The first step should feel already started, and the last steps should feel close.
Who discovered the goal-gradient effect?
Behaviourist Clark Hull first described it in 1932 after observing rats run faster as they neared food. Kivetz, Urminsky and Zheng confirmed it in consumers in 2006.
Why do progress bars increase completion?
They make the remaining effort visible and finite, and as the bar fills the goal feels closer, which increases motivation to finish.
How do you measure Goal-Gradient Effect in a product?
Compare completion rates of multi-step flows with and without progress indicators or head starts, and look at where in the journey people drop off. Time between steps should shorten as users near the end if the effect is working.
Sources
- Hull, C. L. (1932). The goal-gradient hypothesis and maze learning. Psychological Review, 39(1). Find on Google Scholar ↗
- Kivetz, R., Urminsky, O. & Zheng, Y. (2006). The goal-gradient hypothesis resurrected: Purchase acceleration, illusionary goal progress, and customer retention. Journal of Marketing Research, 43(1). Find on Google Scholar ↗
Related laws
 Motivation & emotion
Zeigarnik Effect
People remember unfinished or interrupted tasks better than completed ones, and feel a pull to return and complete them.
 Motivation & emotion
Endowment Effect
People value things more once they feel they own them — including progress, content and customizations inside an app.
 Motivation & emotion
Flow
Flow is the state of full, energized focus people reach when a task's challenge closely matches their skill and they get clear, immediate feedback.
 Decision-making
Commitment & Consistency
Once people make a small commitment, they are more likely to make larger commitments that are consistent with it.
Goal-Gradient Effect in practice
- UI/UX designOnboarding screen examples: 40 patterns that get users to value faster40 app onboarding examples and patterns — welcome, sign-up, personalisation, permissions, empty states and first success — and why each works.
- Original dataApp retention in India: what published install and retention data says about how long Indian users keep appsApp retention in India from published data: day-1 and day-30 retention by category, the 2026 drop in shopping app retention, and what it means for app teams.
- Career guidesHow to get a behavioral design job in 2027: applying behavioural science to products ethically — friction, defaults, motivation and testingHow to get a behavioral design job in 2027: behavioural science for products, friction, defaults, motivation, ethics, dark pattern rules and testing.
- Career guidesUX/UI design fundamentals in 2027: the beginner skills that get you a first design job — process, research basics, wireframes, hierarchy, heuristics and accessibilityUX/UI design fundamentals for 2027: the beginner skills behind a first design job — process, research, wireframes, hierarchy, heuristics and accessibility.
- App marketing & ASOHow to increase app downloads for free: 12 channels that compound12 free ways to increase app downloads: ASO, featuring nominations, web SEO and deep links, referrals, partnerships, PR and in-app sharing.
- Career guidesDecision-making skills at work in 2027: framing decisions, setting criteria, weighing options, deciding at the right speed, involving the right people, avoiding bias, committing and learning from decisionsDecision-making skills at work in 2027: framing, criteria, weighing options, right speed, involving people, avoiding bias, committing and learning.
Certifications that test it
- Free certification · UX/UI, Design, Research & CreativeProduct Design CertificationCertifies end-to-end product design: framing problems against business goals, designing and shipping solutions with engineering, and measuring their impact.
- Free certification · UX/UI, Design, Research & CreativeBehavioral Design CertificationCertifies that you can apply behavioral psychology and behavioral economics to product design ethically — motivation, decision architecture, habits and the laws of UX.
- Free certification · Product, Project Management & Business AnalysisProduct Manager CertificationCertifies that you can run product well — discovery, strategy and prioritization, metrics, delivery with design and engineering, and launch.
- Free certification · UX/UI, Design, Research & CreativeService Design CertificationCertifies that you can design services end to end — customer journeys, service blueprints, research and co-design, and delivery and measurement across channels.
- Free certification · Product, Project Management & Business AnalysisProduct Strategy CertificationCertifies that you can set product strategy — customer and market insight, positioning and differentiation, strategic choices and bets, and outcome roadmaps and OKRs.
- Free certification · Data Analytics & Business IntelligenceProduct Analytics CertificationCertifies that you can turn product data into decisions — metrics and instrumentation, funnels and conversion, retention and cohorts, and A/B testing and statistics.




Get the ideas, not the noise.
Sign up with Google and we’ll send you short UX psychology tips by email — why people tap, stall and leave, and what to do about it. Unsubscribe anytime. Prefer something to keep? Get the free Laws of UX guide as a PDF.